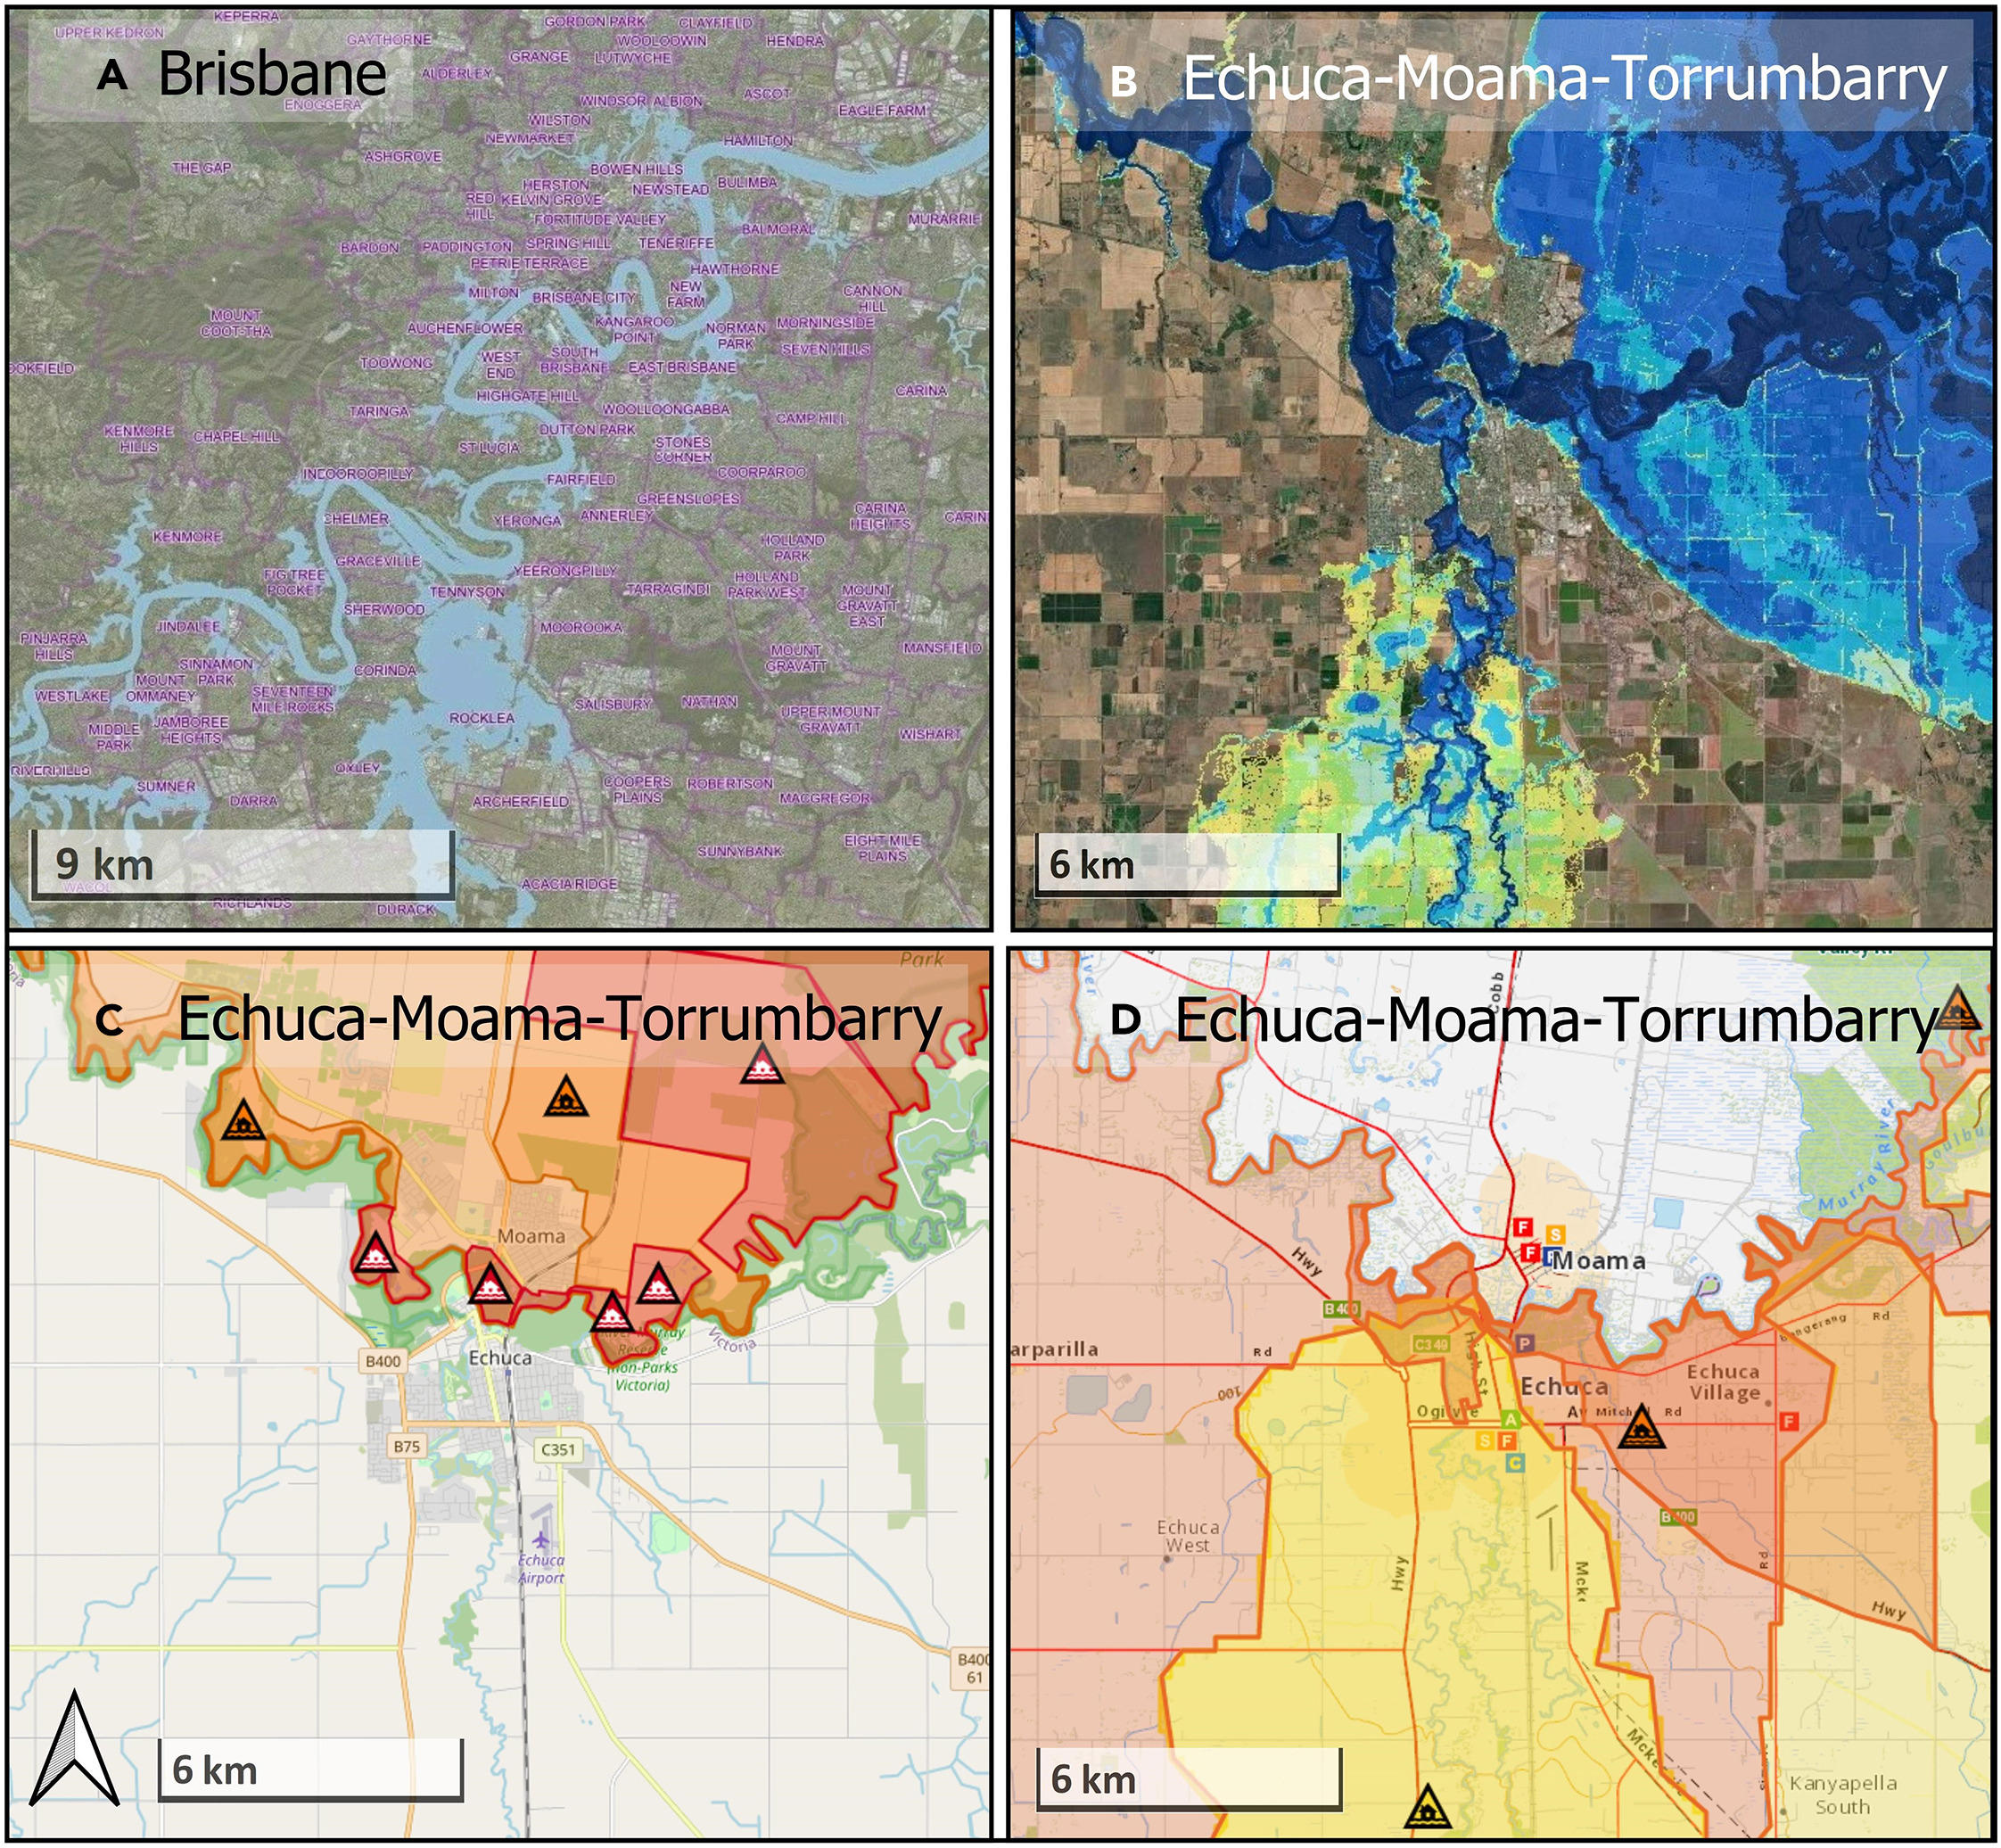
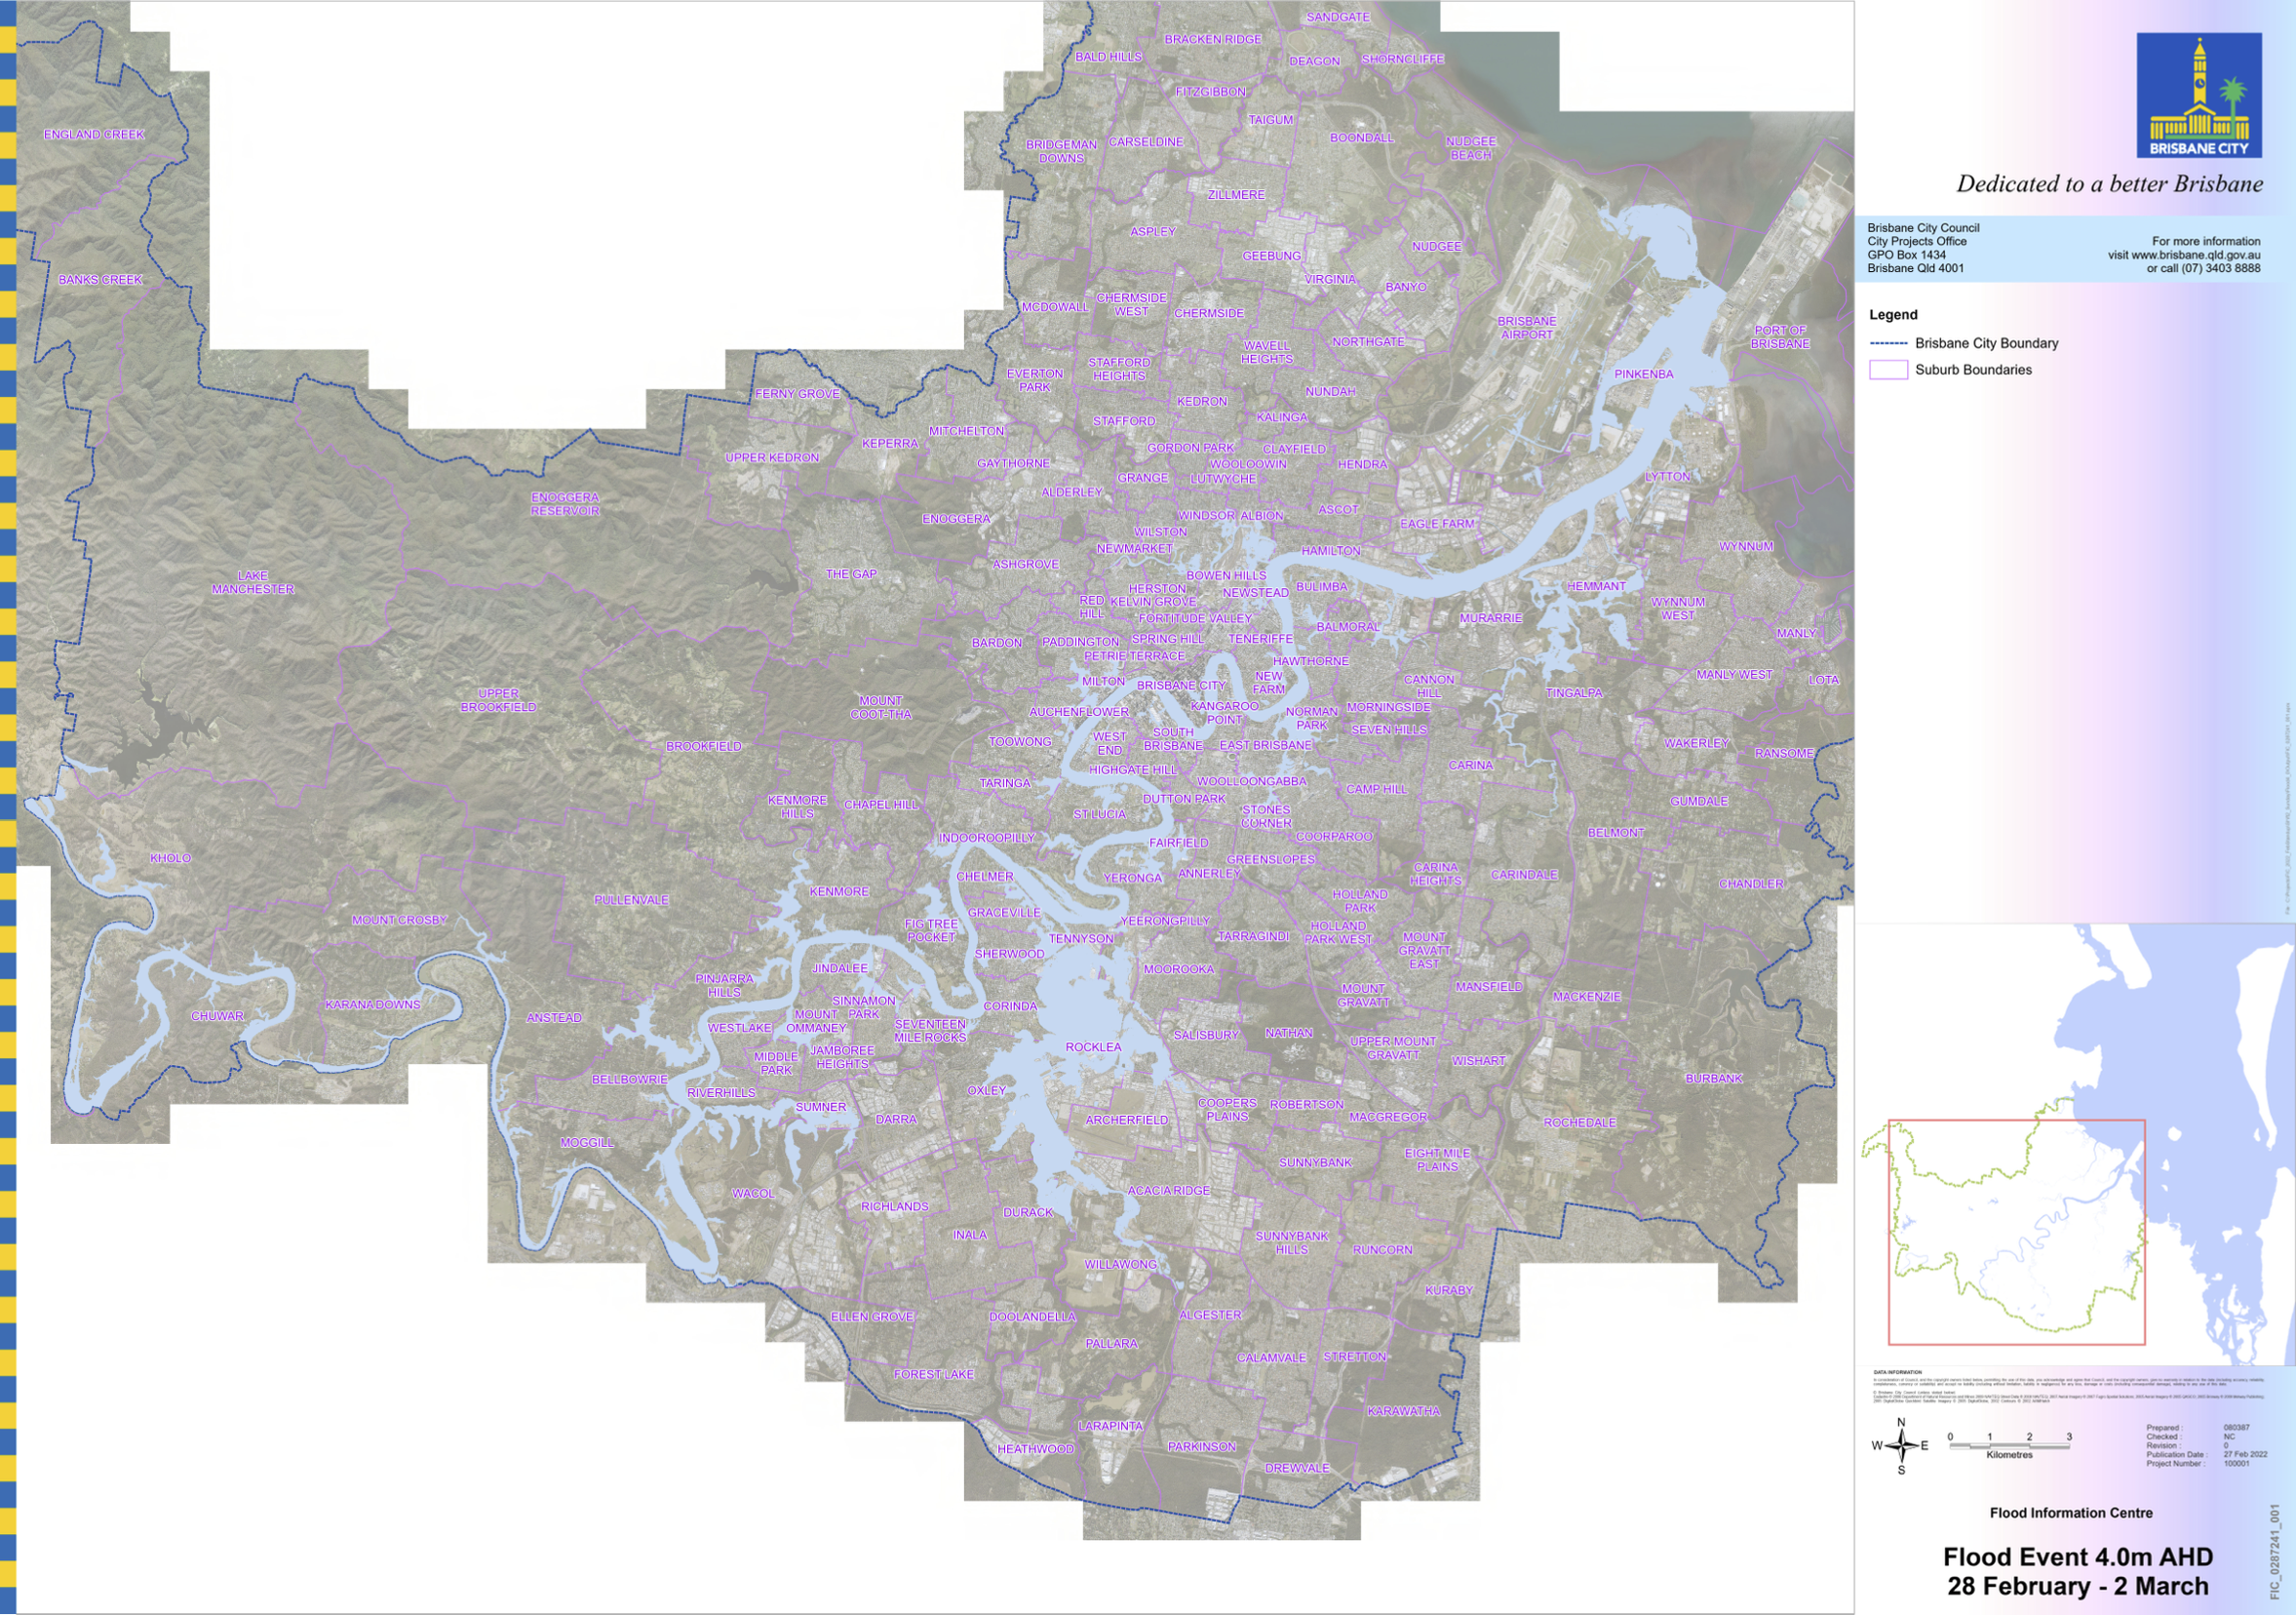
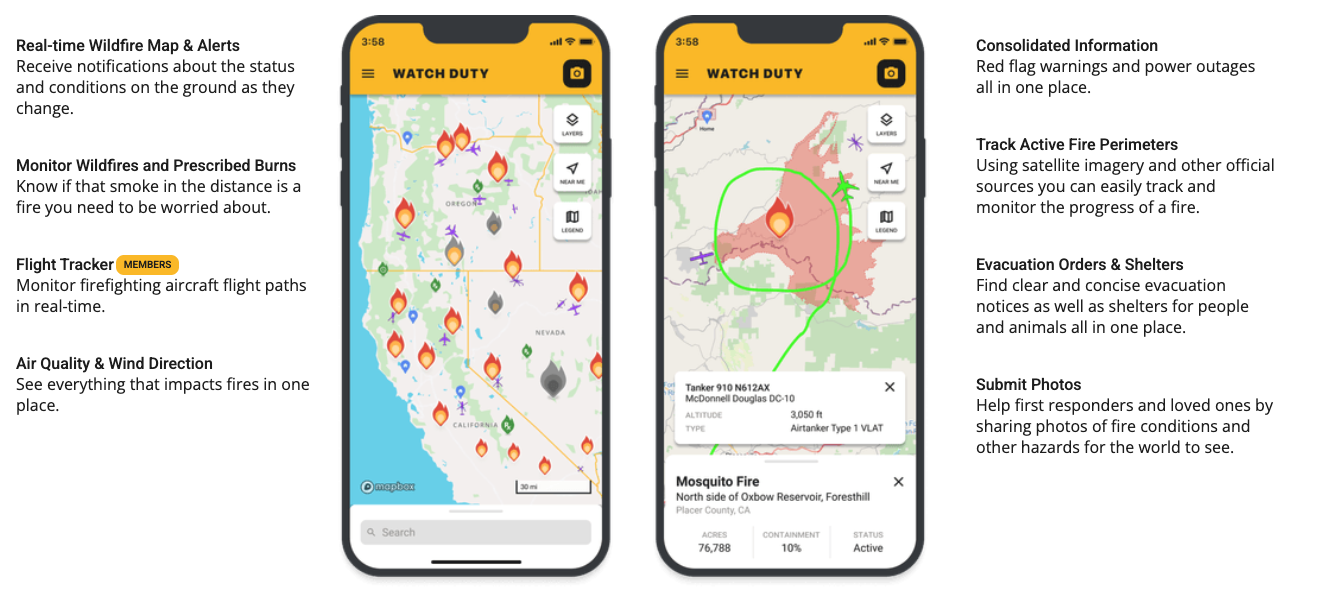
Even zoomed in the map is still not useful for people understand their exposure
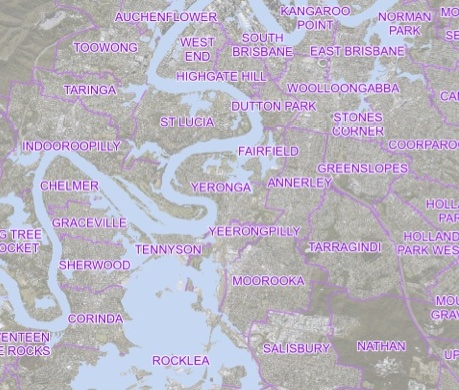
Source: https://www.brisbane.qld.gov.au/ (now expired)
There was a look up table to search addresses
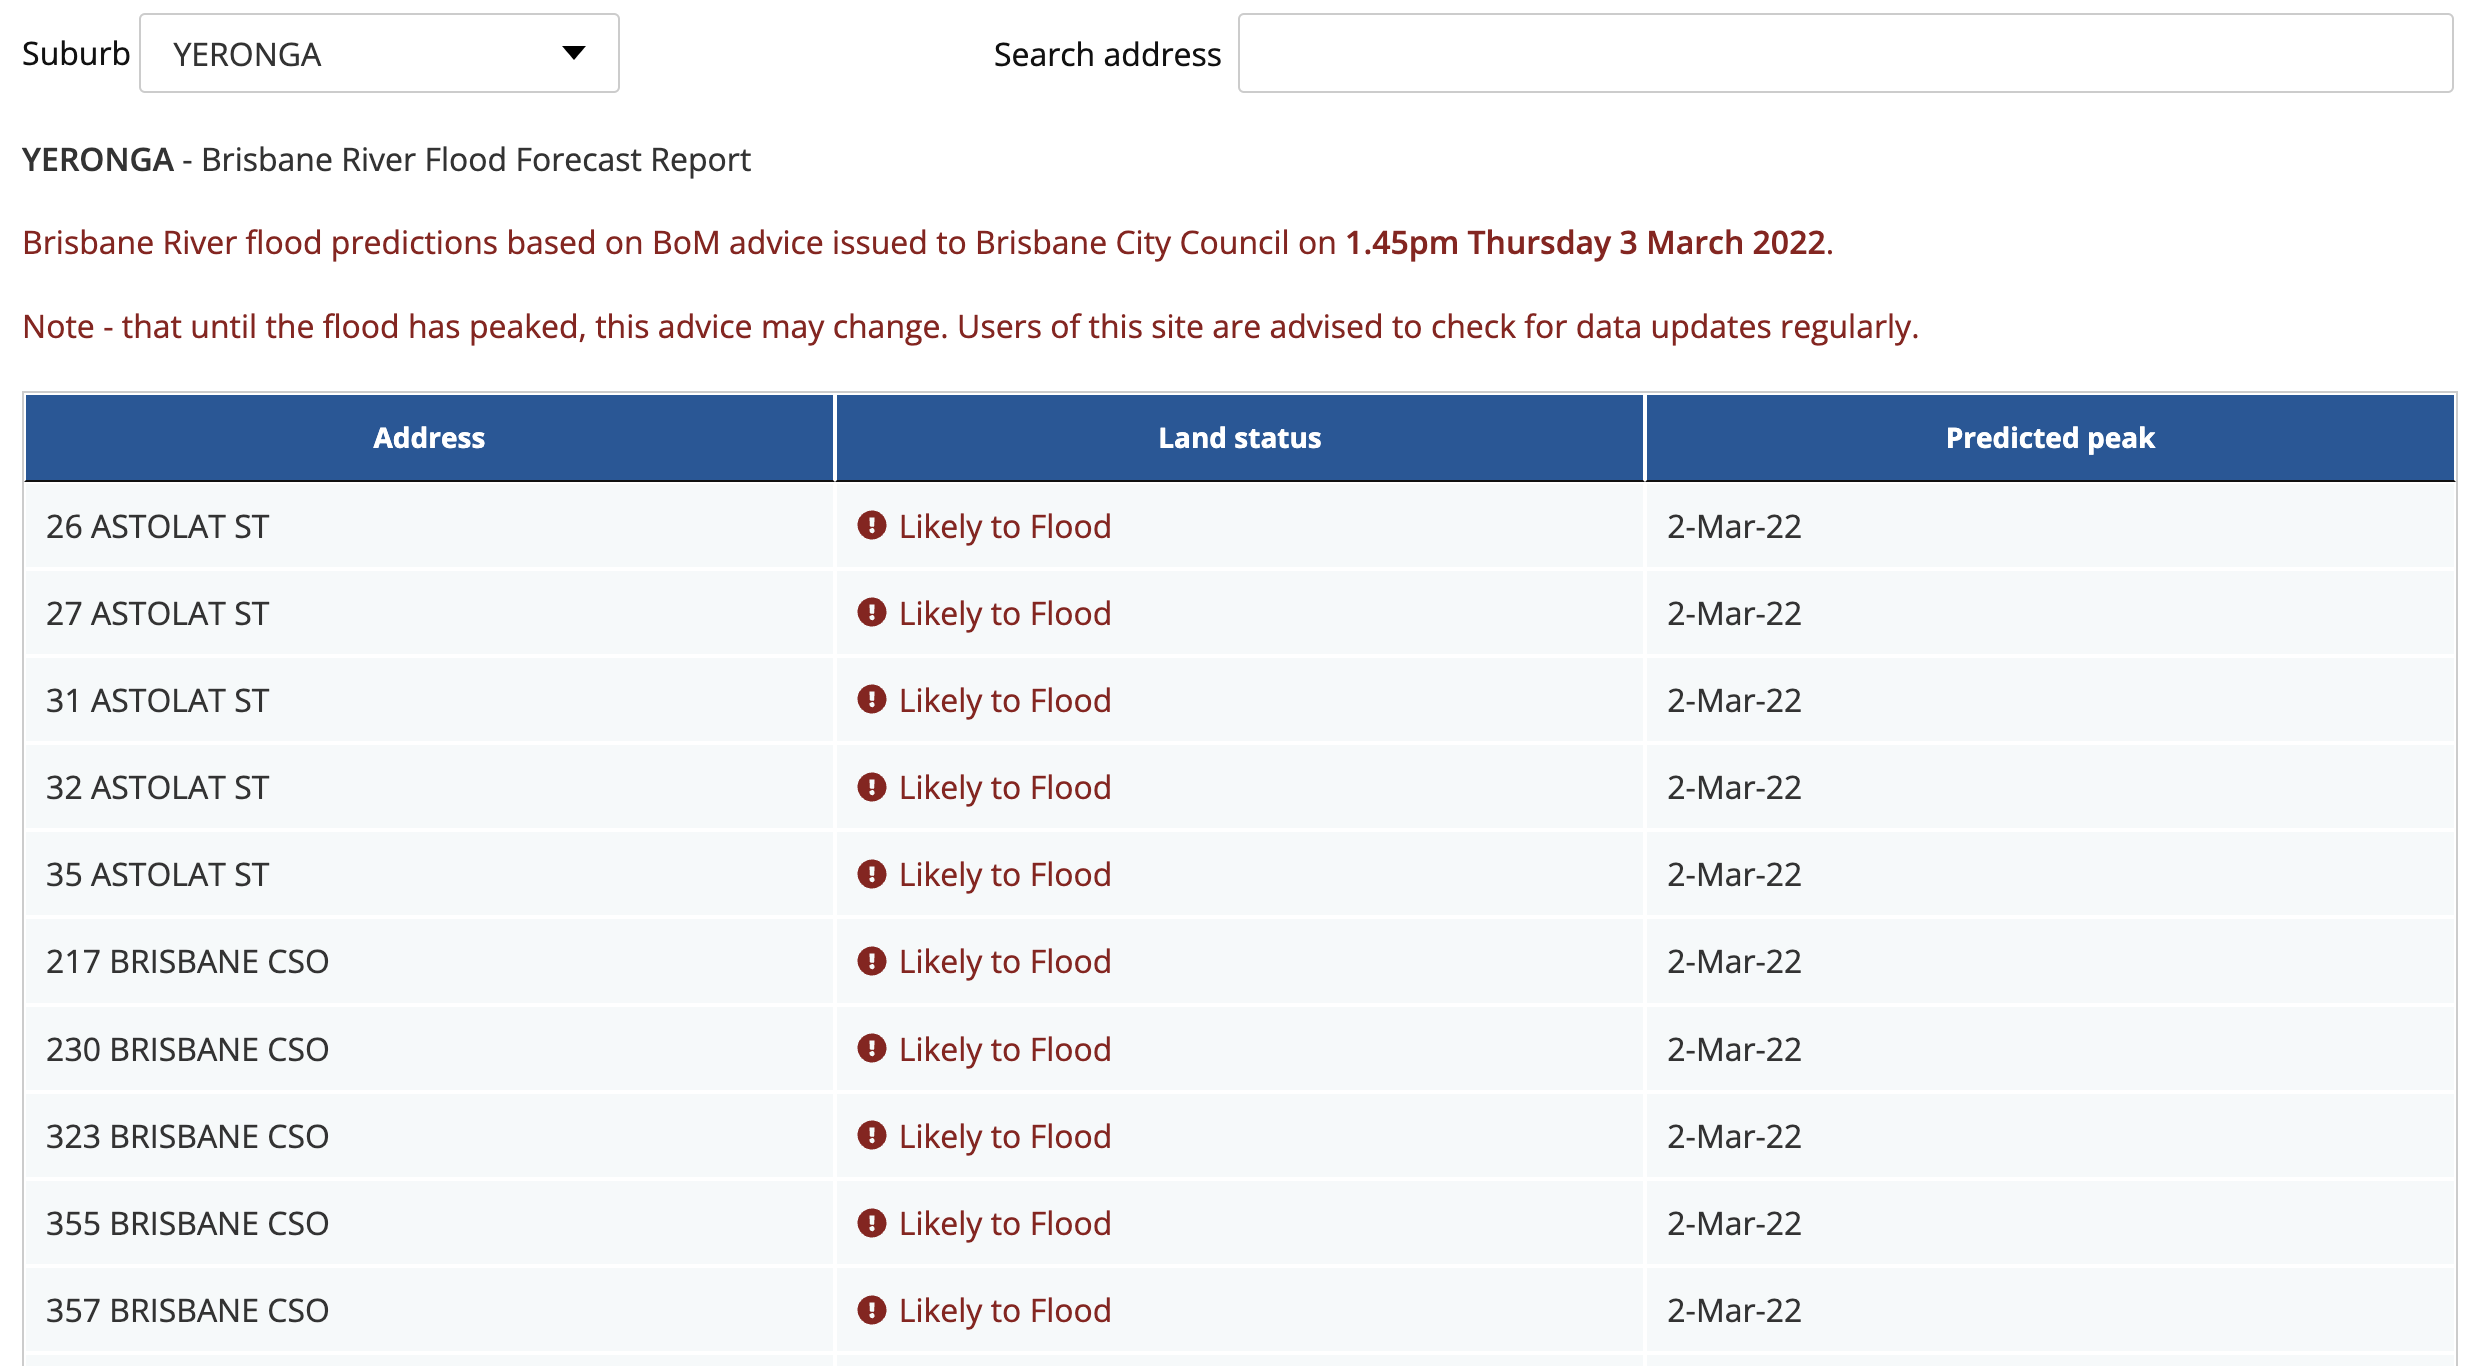
Source: https://www.brisbane.qld.gov.au/ (now expired)
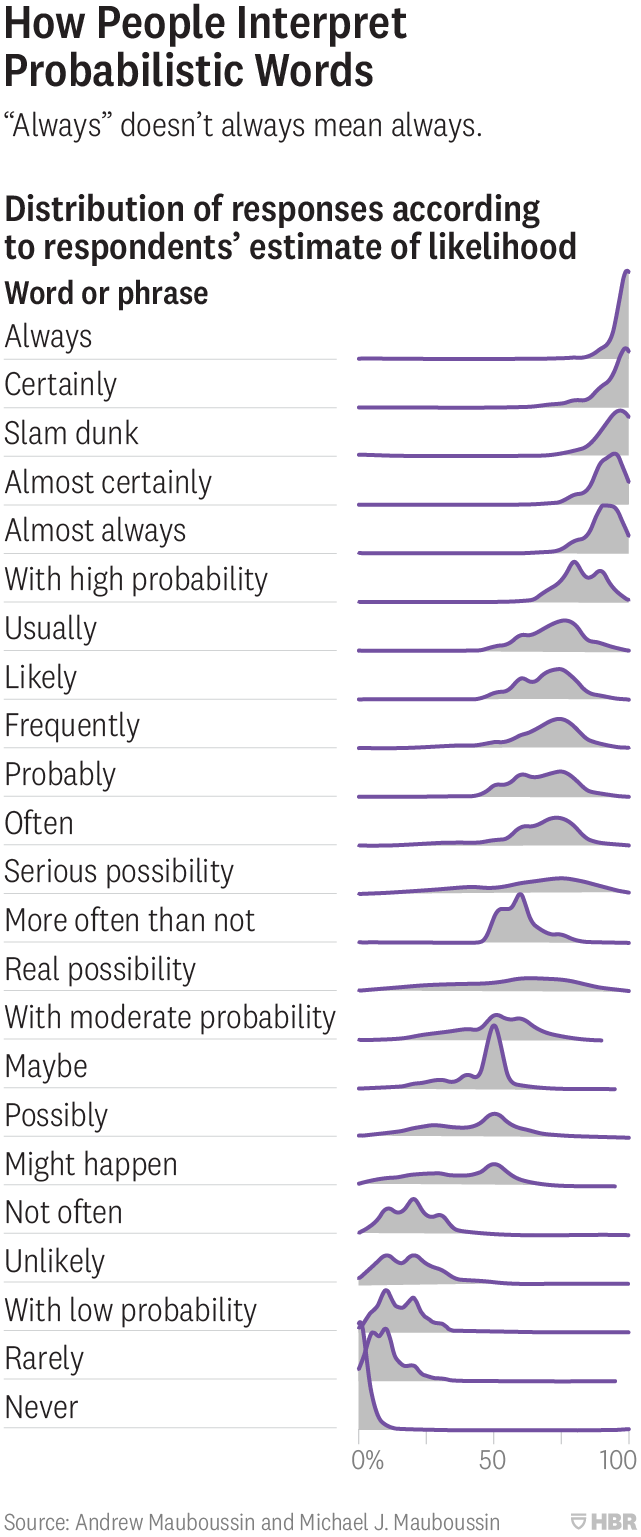
People interpret probabilistic words in differently
Likely roughly corresponds to 50% - 70%.
Source: https://hbr.org/2018/07/if-you-say-something-is-likely-how-likely-do-people-think-it-is
- Let’s say you did decide to evacuate, it was not clear how …
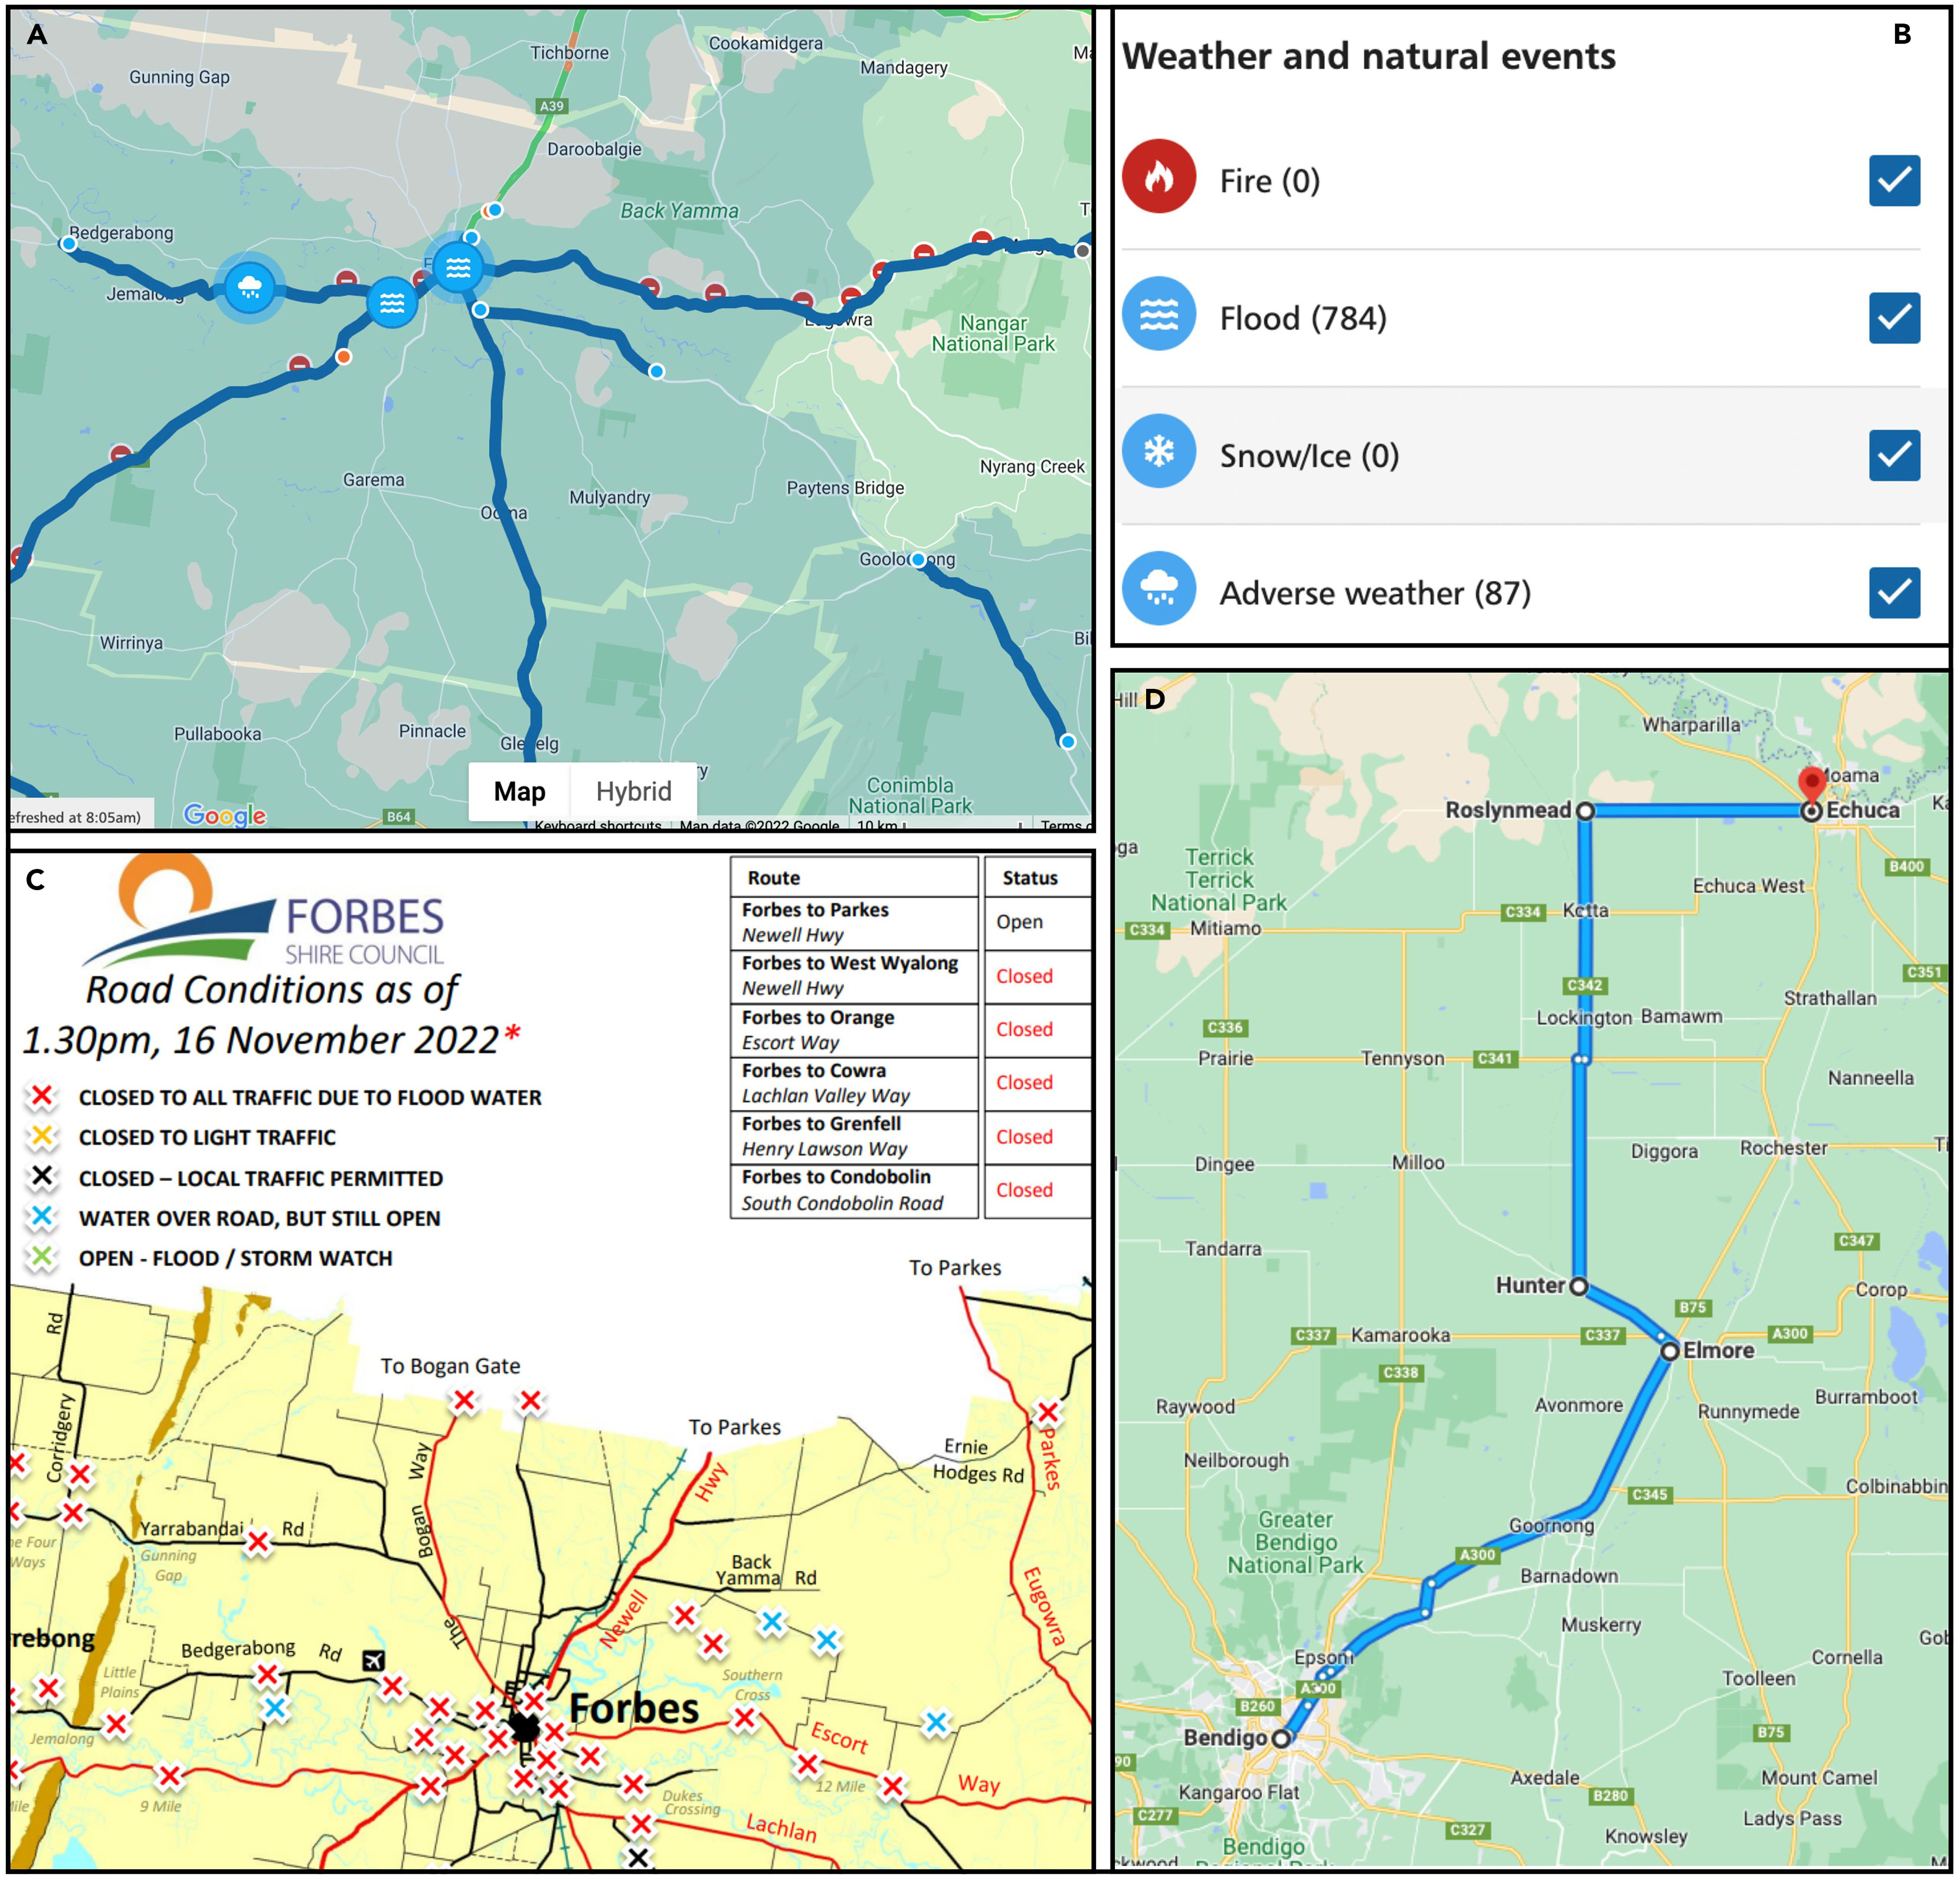
- Road traffic information was out of date, including Google and Uber stopped working
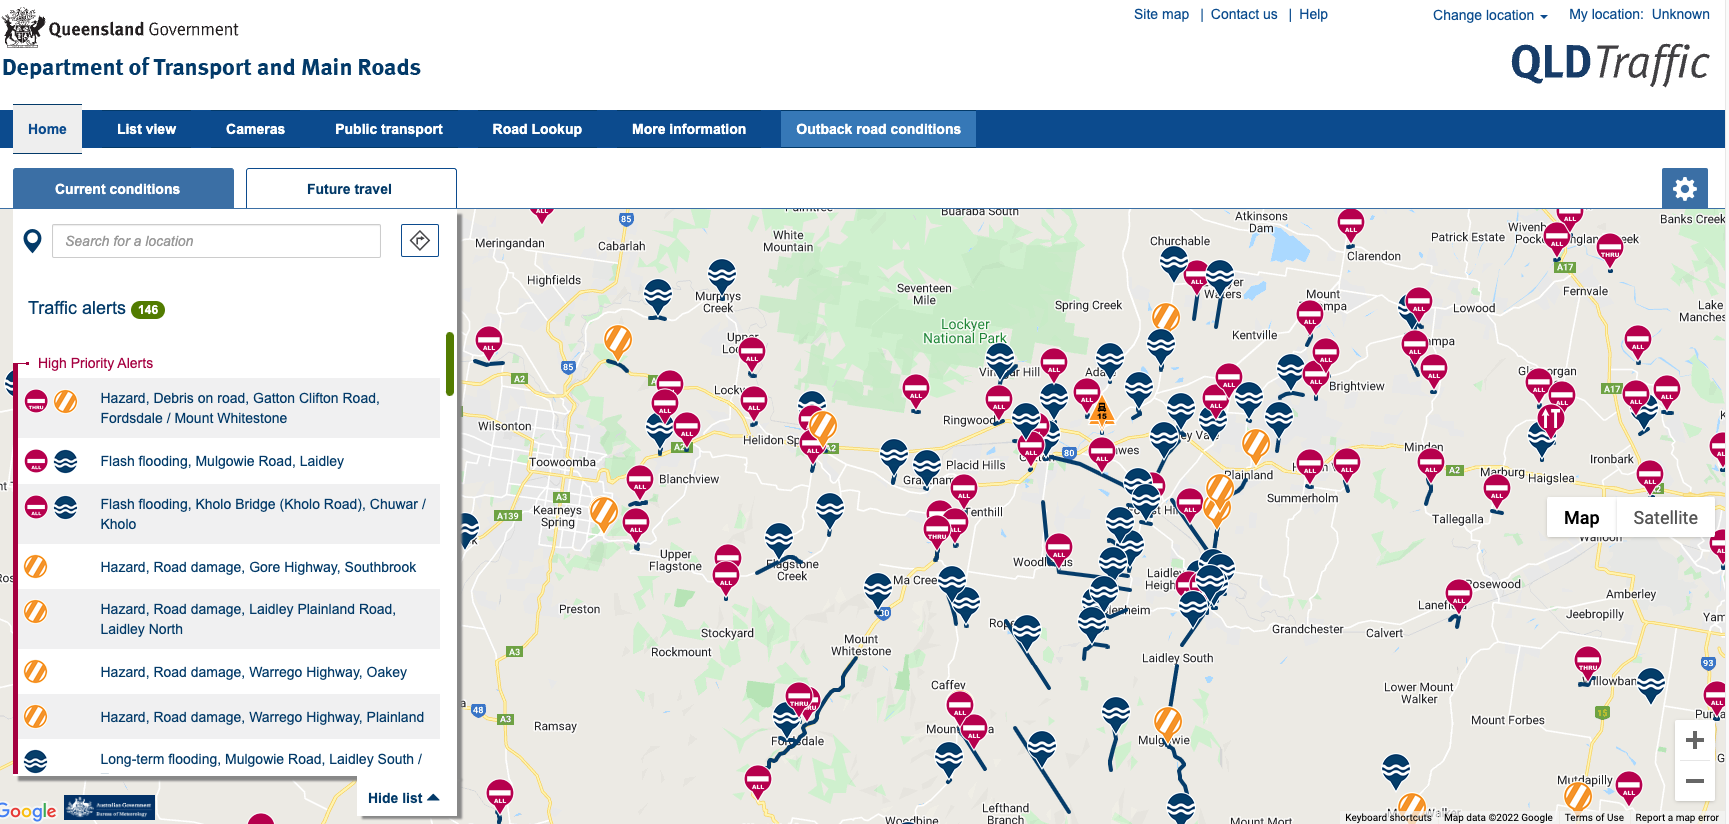
Source: https://qldtraffic.qld.gov.au/ (now expired)
Digital Mud Army: Online Hackathon
Hackathon Topics
- Visualising flood extents
- Real-time social media data
- Road closures
- Comparing past events
- Community vulnerability
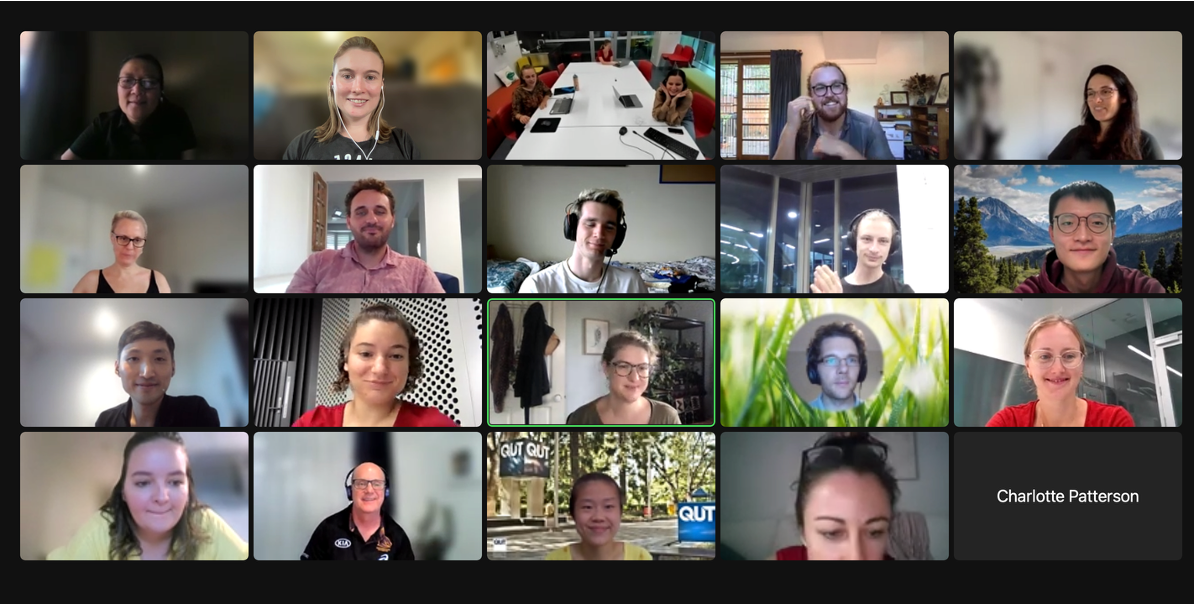
People mucked in to help in lots of different ways - from writing complex code to downloading data manually from webpages
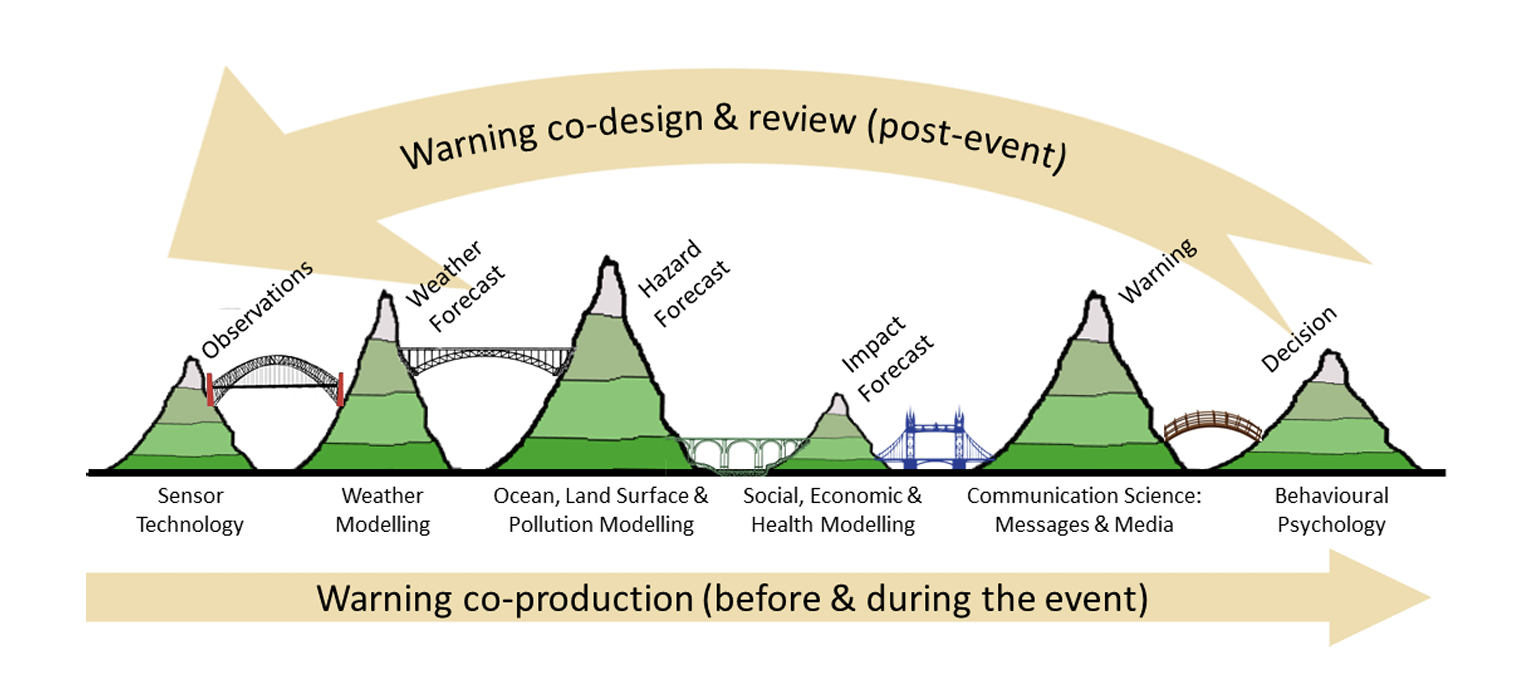
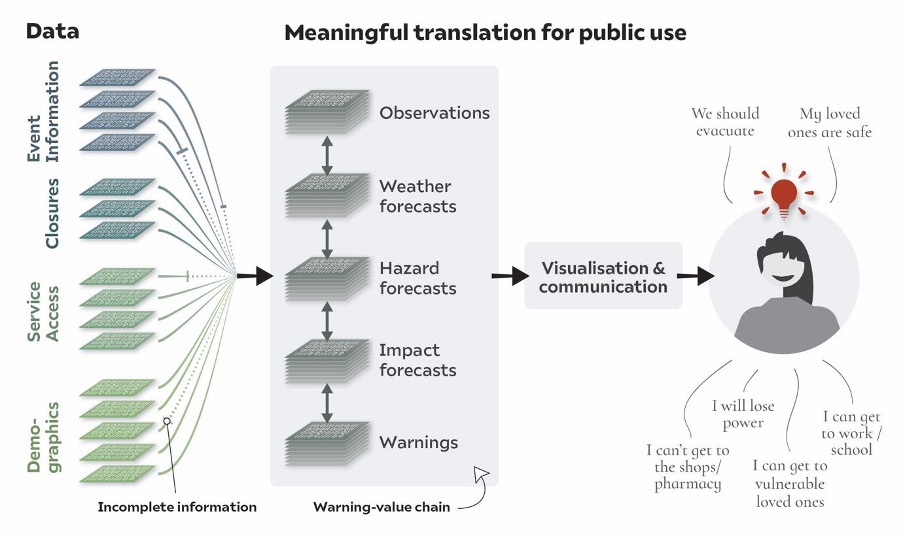
Warning Value Chain
1
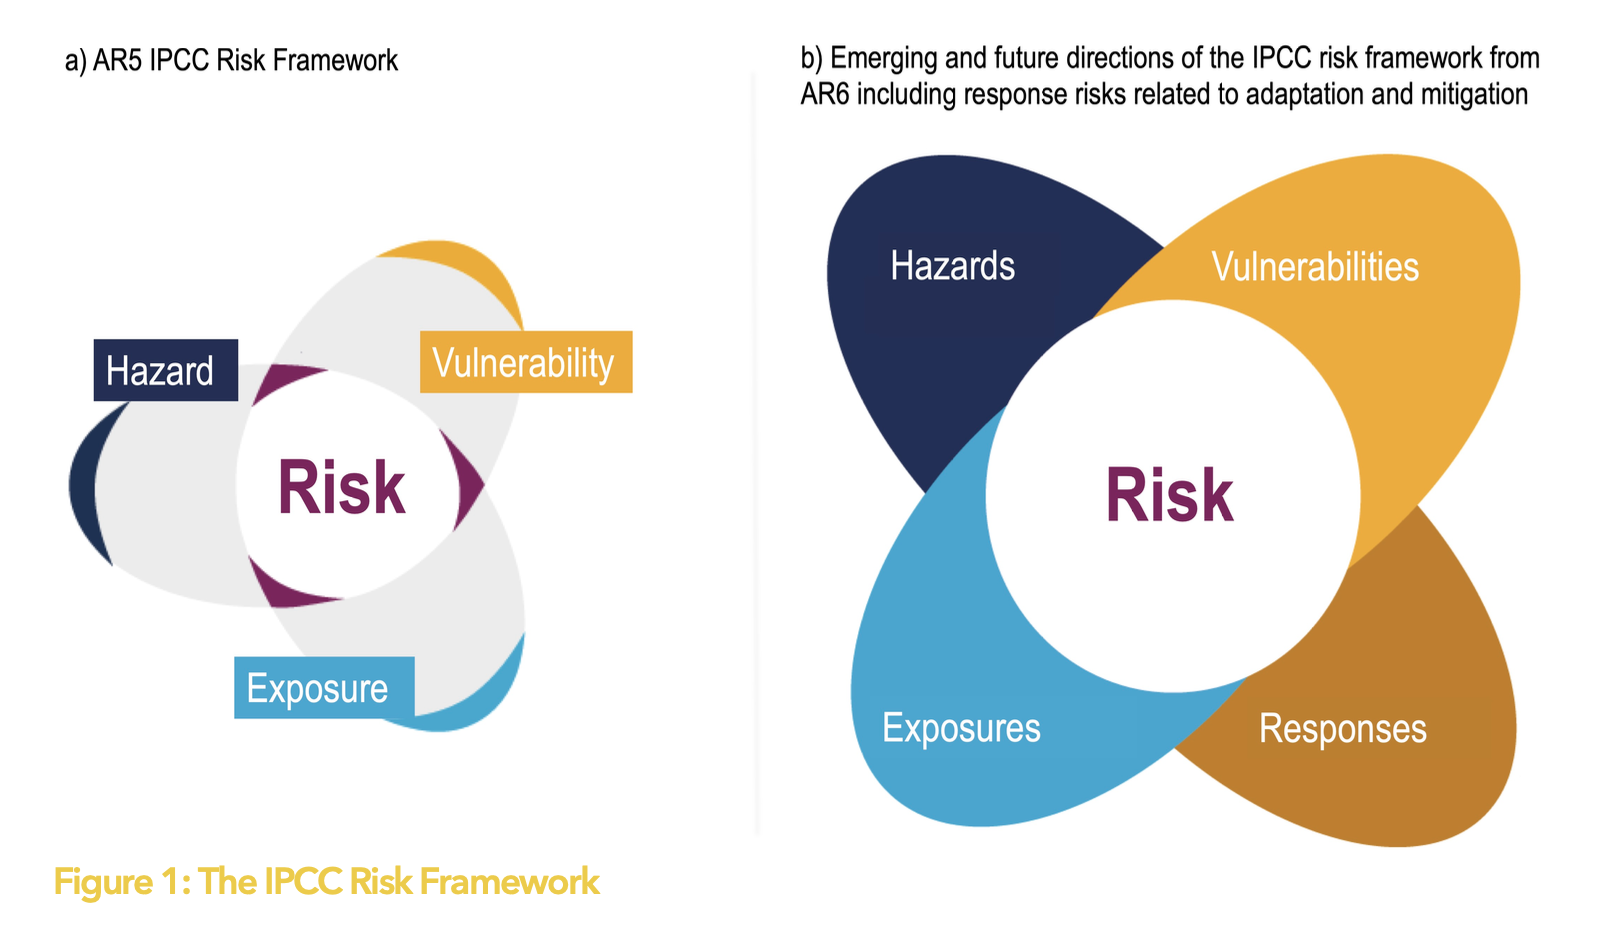
Risk Framework
 1
1
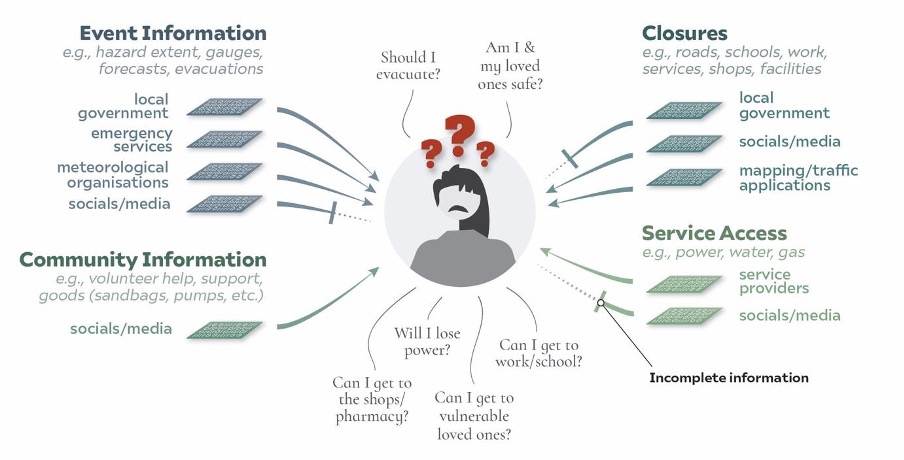
Suffering from a digital deluge
People delay taking preventative action while they piece together their data-story
Hazard warnings
Impact warnings
NSW Hazard Watch 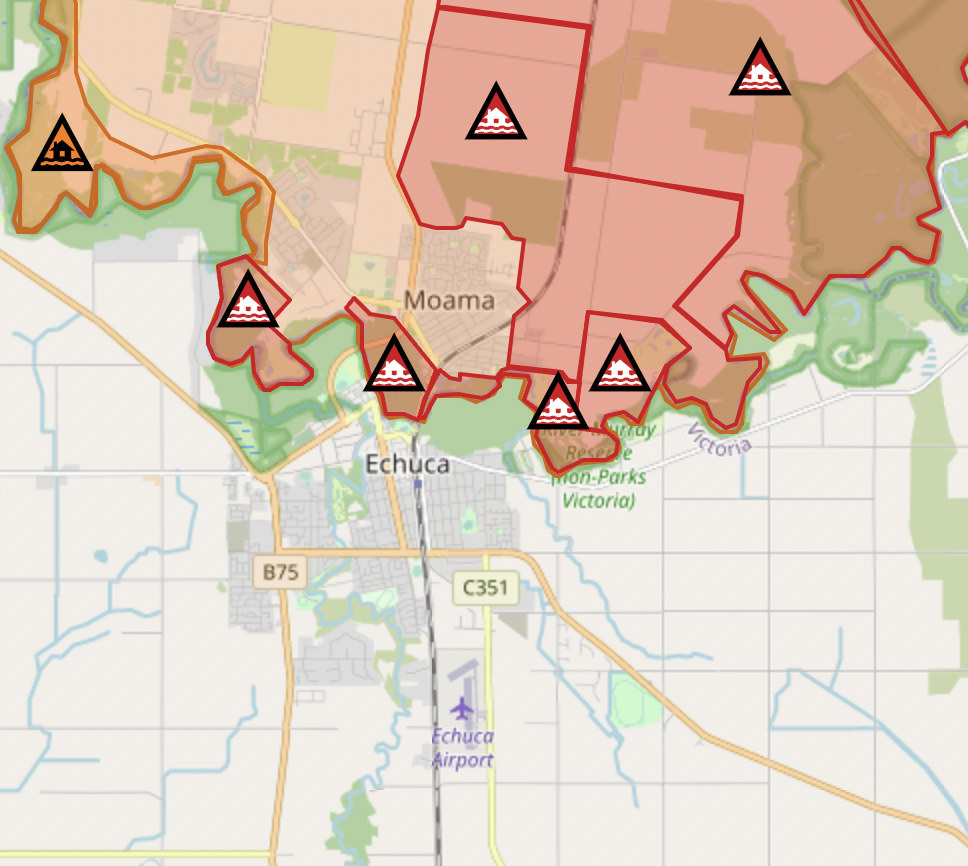
Vic Alert 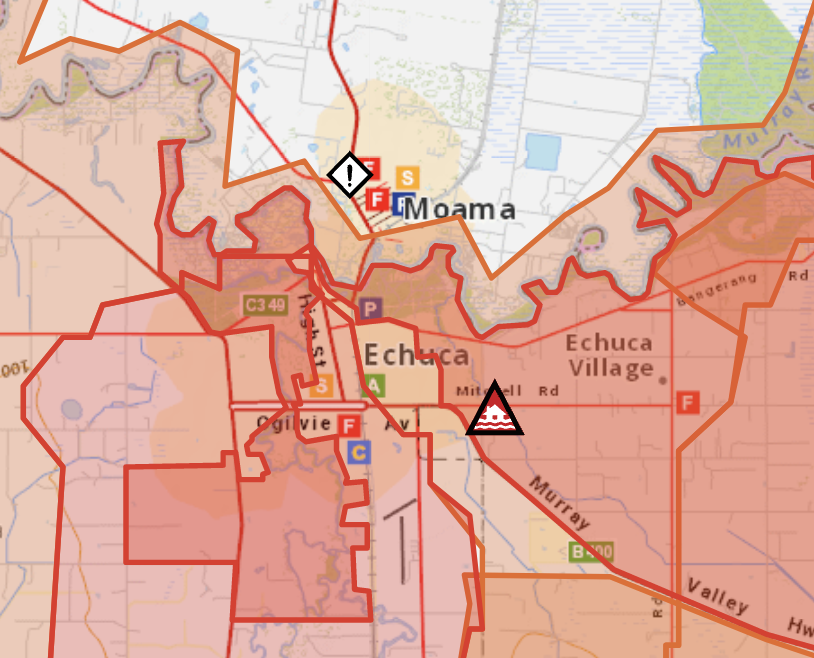
Avoiding data silos
Natural disasters do not adhere to institutional remits or geographic borders!
Many warnings are not reproducible
If data disappears it is difficult to evaluate if warnings were reliable and sufficient to act upon
Need to get our data talking!
Then we can have improved, more user-centric warnings
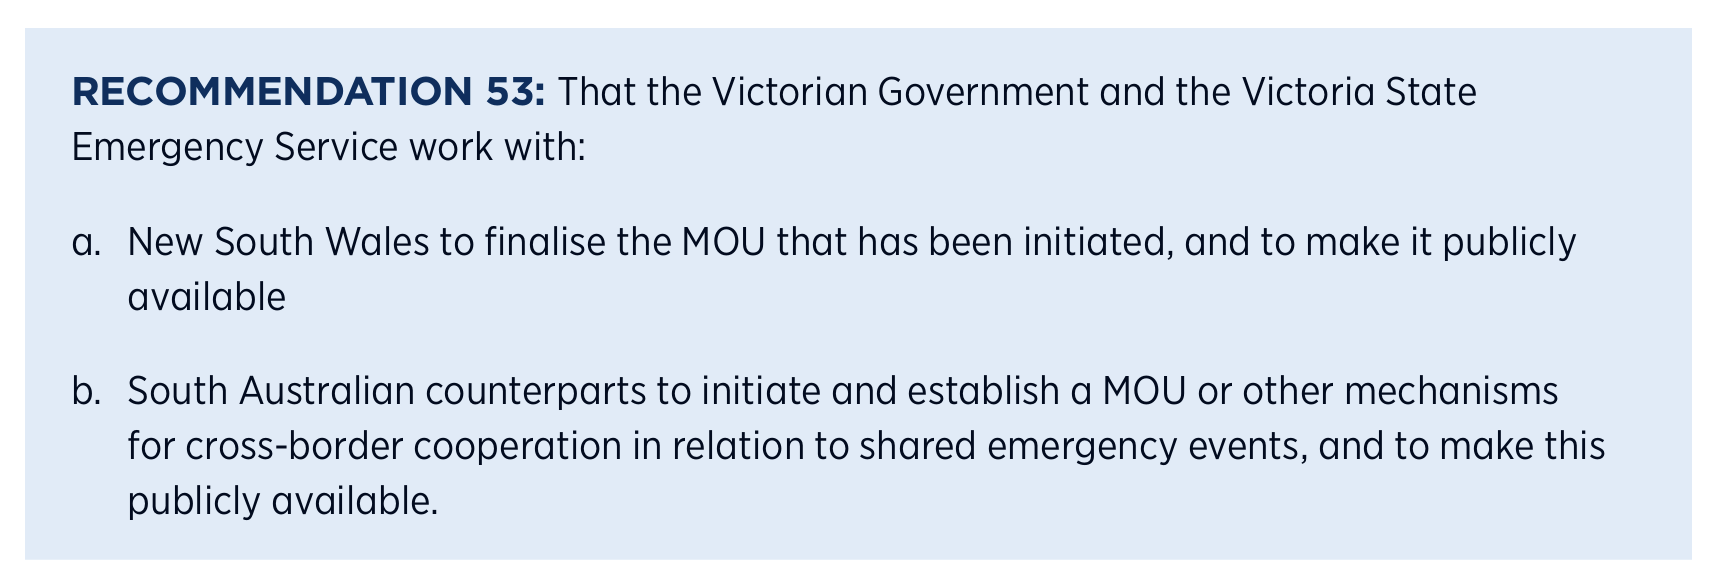
Parliamentary Inquiry into the 2022 Flood Event in Victoria
Final report, Finding and recommendations delivered 30th July 2024
Below are findings and recommendations related to my submission